As ESG regulations become stricter, businesses need a better way to collect, manage, and report sustainability data. Manual spreadsheets and disconnected systems are no longer enough to meet compliance requirements.
That’s why many organizations are investing in custom ESG reporting software development But before starting a project, one question comes first:
How much does ESG reporting software cost?
The avg. The cost of building ESG software ranges between $25,000 and over $500,000. But the actual cost depends on several factors, including the features you need, reporting frameworks, system integrations, AI capabilities, and the complexity of your business.
Many articles only compare software subscriptions or list vendor pricing. They rarely explain what it actually costs to build ESG reporting software, where the budget goes, and which decisions have the biggest impact on the final price.
- ESG reporting software cost by build tier
- Phase-wise development budget
- Feature-wise pricing breakdown
- The biggest cost-driving factors
- Build vs. buy comparison
- Hidden and post-launch expenses
- ROI and payback analysis
- Practical ways to reduce development costs without compromising compliance
By the end of this guide, you’ll understand what drives ESG reporting software cost and how to budget for your project with confidence.
ESG Reporting Software Cost: The Quick Answer
Custom ESG reporting software cost typically runs between $60,000 and $750,000. Where you land depends on framework count, data complexity, and how much assurance work the system automates.
Here is the fast view before we open each layer.
| Build Tier | What It Covers | Typical Cost | Timeline |
|---|---|---|---|
| Compliance-Ready MVP | Single framework, Scope 1 and 2 tracking, guided manual entry, core dashboard | $60,000 to $120,000 | 4 to 6 months |
| Mid-Market Platform | Two or three frameworks, partial Scope 3, ERP integration, approval workflows | $120,000 to $250,000 | 6 to 9 months |
| Enterprise System | Multi-framework mapping, supplier portal, immutable audit trail, multi-entity consolidation | $250,000 to $500,000 | 9 to 14 months |
| AI-Powered Enterprise Platform | Everything above plus anomaly detection, disclosure drafting, scenario modelling | $500,000 to $750,000+ | 12 to 18 months |
Before budgeting for ESG reporting software, there are several important factors that can significantly impact overall cost, timeline, and implementation complexity. Understanding these considerations early helps avoid unexpected expenses and ensures a more strategic investment.
- Frameworks drive price more than features: Supporting one standard is contained work, while reconciling multiple frameworks significantly increases the complexity of mapping logic behind every metric.
- Scope 3 is the single biggest line: Supplier data collection and emissions tracking can consume a substantial portion of an enterprise-level ESG platform budget.
- Hidden costs often exceed the quote: Data cleansing, supplier onboarding, and audit or assurance preparation are often underestimated or excluded in initial proposals.
- Year two is not free: Plan for ongoing costs of 15% to 20% of the initial build annually to cover maintenance, cloud infrastructure, and regulatory updates.
- Modular sequencing protects the budget: Prioritizing development based on compliance deadlines helps control costs instead of building all features at once.
ESG Reporting Software Cost by Build Tier
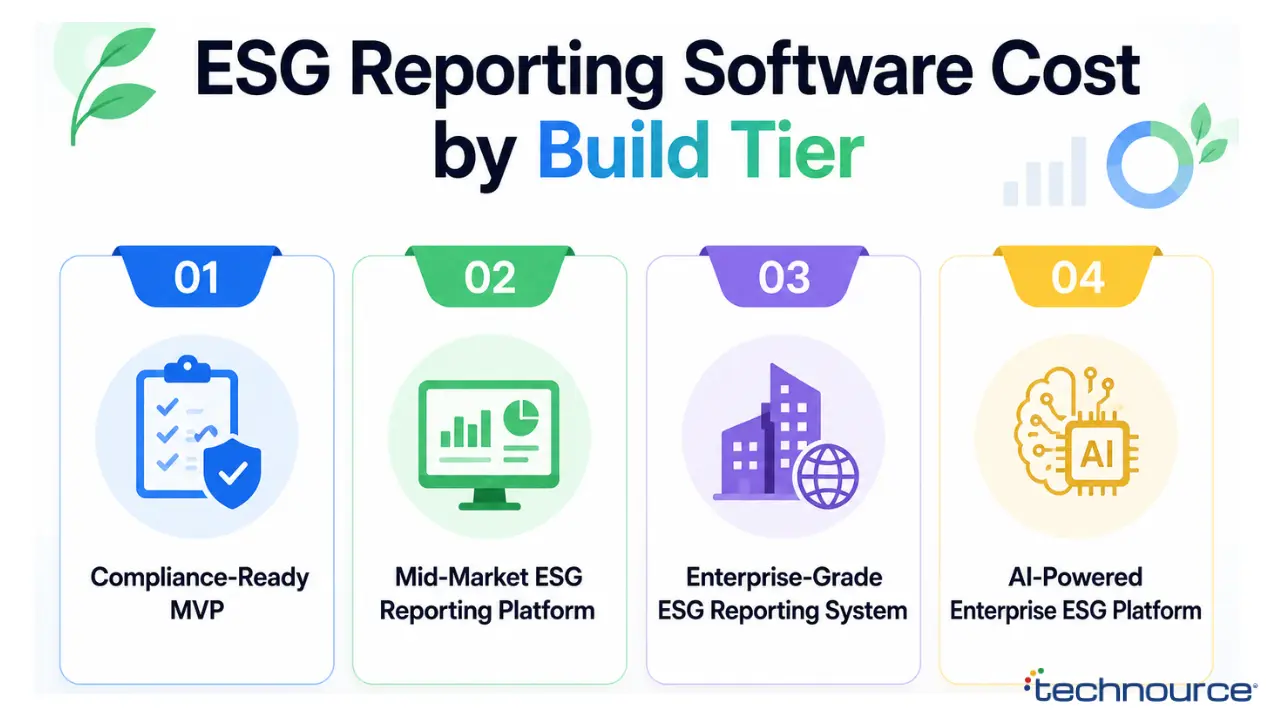
Now let us put real numbers against real scope. The four tiers below reflect how ESG reporting software cost behaves across genuinely different levels of ambition.
1. Compliance-Ready MVP
This build answers one regulator, tracks Scope 1 and Scope 2 emissions, and gives you a defensible report without heroics. You get guided data entry, validation rules, a core dashboard, and export in your auditor’s required format. That is usually enough for a first mandatory cycle.
2. Mid-Market ESG Reporting Platform
Here the system starts talking to your other systems. Expect two or three frameworks, live connections into finance and HR platforms, and partial Scope 3 categories. Structured approval workflows then move data from department to disclosure without email chains.
3. Enterprise-Grade ESG Reporting System
At this level, the platform becomes a system of record. It consolidates multiple legal entities across currencies and regions and runs a supplier data portal. It also keeps a time-stamped evidence trail and maps one dataset across every standard you report against.
4. AI-Powered Enterprise ESG Platform
The top tier adds intelligence on top of infrastructure. Machine learning flags anomalies in supplier submissions, drafts narrative disclosure from structured data, and models climate scenarios. All of that demands specialised data science work during the build.
ESG Reporting Software Cost Split by Development Phase
Breaking the budget into phases gives your finance team funding milestones instead of one intimidating number. It also creates natural quality gates before each release of capital.
| Development Phase | Budget Share | MVP Range | Enterprise Range |
|---|---|---|---|
| Discovery, Data Mapping and Architecture | 15% | $9,000 to $18,000 | $37,500 to $75,000 |
| Core Backend and Calculation Engine | 40% | $24,000 to $48,000 | $100,000 to $200,000 |
| Frontend, Dashboards and Disclosure UI | 15% | $9,000 to $18,000 | $37,500 to $75,000 |
| QA, Security Testing and Calculation Validation | 15% | $9,000 to $18,000 | $37,500 to $75,000 |
| Deployment, Integration and Data Migration | 8% | $4,800 to $9,600 | $20,000 to $40,000 |
| Training, Handover and Change Management | 7% | $4,200 to $8,400 | $17,500 to $35,000 |
Phase 1. Discovery, Data Mapping and Architecture
Start here and start slowly, because everything downstream inherits these decisions. Your team inventories every data source, maps each disclosure requirement to a field, agrees the entity hierarchy, and locks the architecture. Skip this, and you will pay for it three times over during integration.
Phase 2. Core Backend and Calculation Engine
This is where most of your money goes, and rightly so. Engineers build the database schema, the emission calculation logic, the framework mapping layer, and the API surface. Every calculation needs to be reproducible on demand, because an auditor will eventually ask how a number was produced.
Phase 3. Frontend, Dashboards and Disclosure UI
Now the system becomes usable by people who are not engineers. You build data entry screens for contributors, review queues for approvers, executive dashboards for leadership, and export templates that match each framework’s required output format.
Phase 4. QA, Security Testing and Calculation Validation
Treat this phase as non-negotiable rather than a cleanup pass. Beyond functional testing, your team validates every calculation against published methodology and runs security assessments on sensitive data. It also confirms that access controls behave correctly under real user conditions.
Phase 5. Deployment, Integration and Data Migration
Here the platform meets your live environment. The team provisions production infrastructure, connects the ERP and HR systems, and migrates historical disclosure data. It then confirms that data residency rules hold in every region you operate in.
Phase 6. Training, Handover and Change Management
Finish by making the system stick. Contributors across finance, procurement, and operations need to understand what they enter and why. Your internal owners need documentation detailed enough to run the platform without weekly calls to the build team.
Feature-Wise ESG Reporting Software Cost Breakdown
Module-level pricing is how you decide what to fund now and what to defer. The table below shows how a typical enterprise ESG reporting software cost distributes across the twelve modules that matter.
| Module | Cost Contribution | Build Complexity |
|---|---|---|
| User Management and Role-Based Access | $6,000 to $14,000 | Low |
| ESG Data Collection Engine | $20,000 to $45,000 | High |
| Carbon Accounting and Calculation Module | $25,000 to $55,000 | High |
| Reporting Framework Mapping Layer | $18,000 to $40,000 | High |
| Supplier Portal and Scope 3 Workflows | $30,000 to $70,000 | Very High |
| Dashboards and Analytics | $12,000 to $28,000 | Medium |
| Custom Report and Disclosure Builder | $15,000 to $35,000 | Medium |
| Workflow Automation and Approvals | $10,000 to $22,000 | Medium |
| Audit Trail and Evidence Management | $14,000 to $32,000 | High |
| Third-Party Integrations | $15,000 to $50,000 | Varies |
| Security, Encryption and Compliance Controls | $10,000 to $25,000 | Medium |
| AI Insights and Anomaly Detection | $28,000 to $60,000 | Very High |
1. Data Collection and Integration Layer
Think of this as the plumbing that decides whether everything above it works. It covers connectors into ERP, HR, procurement, and utility systems, plus validation rules that catch bad inputs at the door. Strong data engineering services work here and save far more than it costs.
2. Calculation and Carbon Accounting Layer
This layer converts raw activity data into reportable figures using published emission factors. It needs to handle unit conversion, category classification, and recalculation when a factor library updates, without silently changing a figure you already disclosed.
3. Reporting, Disclosure and Analytics Layer
Here your structured data becomes something a regulator, investor, or board can read. It covers dashboards, narrative disclosure templates, machine-readable exports, and the report builder that lets teams produce a new view without a developer ticket.
4. Governance, Audit and Security Layer
This is the layer that survives scrutiny. Every figure traces back to a source document, and every change carries a timestamp and an owner. Access rights then match the sensitivity of what sits behind them.
12 Factors That Drive ESG Reporting Software Cost
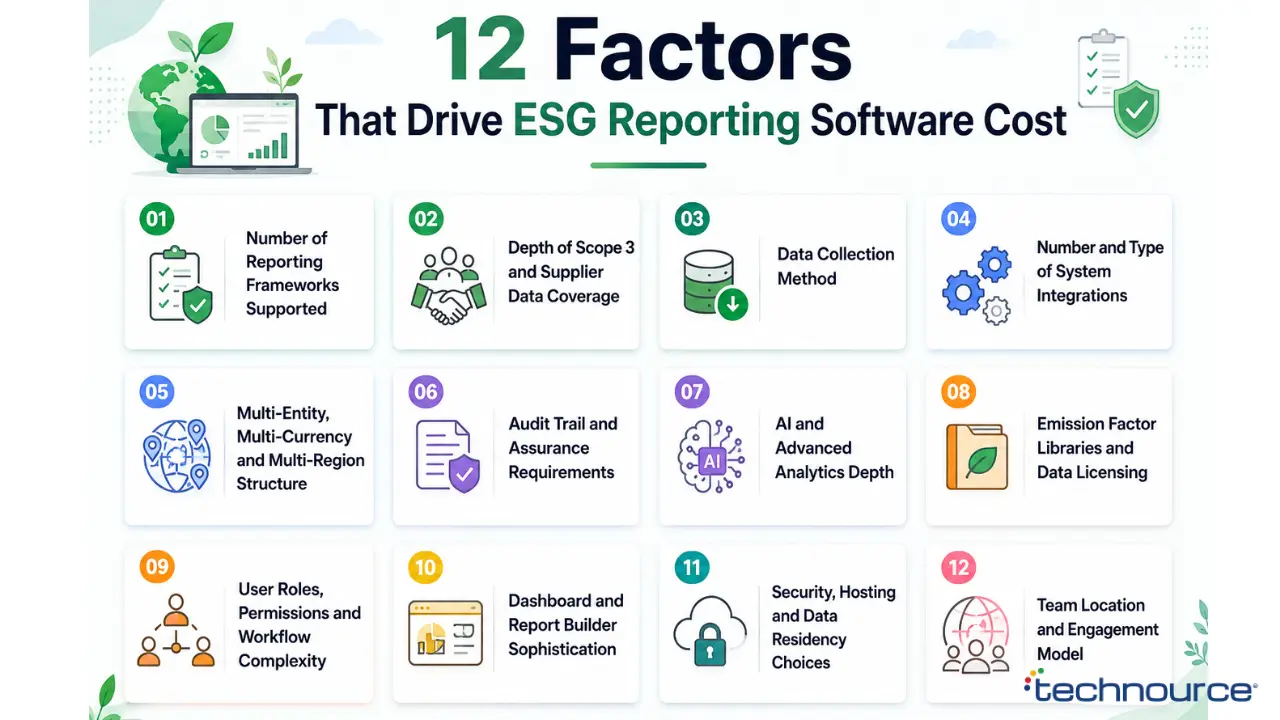
Two companies in the same industry can receive quotes that differ by $300,000. These twelve variables explain almost all of that spread
1. Number of Reporting Frameworks Supported
One standard keeps your mapping engine tidy and predictable. Add a second and a third, and you maintain competing definitions of materiality, boundaries, and metric scope inside one dataset. That is where framework logic starts consuming real engineering hours.
2. Depth of Scope 3 and Supplier Data Coverage
Scope 3 turns your reporting platform into a small marketplace. You need supplier onboarding and submission forms simple enough for a business with no carbon tools. Add reconciliation logic for incomplete responses and category rules across all fifteen categories.
3. Data Collection Method
Manual entry is cheap to build and expensive to live with. Automated collection through utility APIs, building sensors, and fleet systems raises the ESG reporting software cost upfront. It removes the recurring labour that manual processes quietly generate every cycle.
4. Number and Type of System Integrations
Every connection you add carries authentication, error handling, field mapping, and long-term maintenance. A single finance system is straightforward, while a landscape of ERP, HR, procurement, and regional subsidiary tools multiplies the surface area you must keep working.
5. Multi-Entity, Multi-Currency and Multi-Region Structure
Consolidation logic is deceptively expensive. The platform must roll figures up across legal entities, respect regional rules, and convert currency for financial ESG metrics. Each entity must still report independently when required.
6. Audit Trail and Assurance Requirements
Building evidence handling into the database from day one costs more than bolting it on later, and it is the only approach that actually works. Role-based controls, immutable logs, and encrypted document storage all require senior backend engineering rather than junior implementation.
7. AI and Advanced Analytics Depth
AI features typically add 15% to 40% to a build. Anomaly detection, emissions forecasting, and automated disclosure drafting each need training data, evaluation workflows, and guardrails. Treat them as a separate workstream rather than a checkbox.
8. Emission Factor Libraries and Data Licensing
Nobody should be modelling emission factors from scratch. Licensed factor libraries carry recurring fees, and your platform needs proper versioning. A factor update should never retroactively alter a figure you already filed with a regulator.
9. User Roles, Permissions and Workflow Complexity
A five-user system and a five-hundred-user system are different products. Once contributors, reviewers, approvers, auditors, and external assurance partners all need scoped access, permission logic becomes a genuine architectural concern.
10. Dashboard and Report Builder Sophistication
Fixed dashboards are quick to build and frustrating within two cycles. A configurable report builder costs meaningfully more upfront but removes the developer dependency every time leadership wants a new cut of the same data.
11. Security, Hosting and Data Residency Choices
Where data lives changes what you pay. Single-region cloud hosting is straightforward, while residency requirements across multiple jurisdictions demand separate environments, replication strategy, and compliance validation in each location.
12. Team Location and Engagement Model
The same scope costs very differently depending on who builds it. Rate bands vary widely by region, and a fixed-price contract behaves differently from a dedicated team when your requirements shift mid-build, which they usually do.
Team Composition and Rate Bands Behind the Cost
Most cost guides quote a total without telling you who produces it. Understanding the team behind an estimate is the fastest way to judge whether a quote is realistic.
1. The Roles a Real ESG Build Needs
| Role | Why the Build Needs Them | Typical Effort Share |
|---|---|---|
| Solution Architect | Data model, entity hierarchy, integration strategy | 8% |
| Sustainability or Domain Analyst | Framework interpretation, metric definitions, disclosure logic | 10% |
| Backend Engineers | Calculation engine, APIs, business rules | 30% |
| Data Engineers | Pipelines, warehousing, factor libraries, transformations | 18% |
| Frontend Engineers | Dashboards, entry screens, report builder | 15% |
| QA and Security Engineers | Calculation validation, penetration testing, access control checks | 12% |
| DevOps Engineer | Infrastructure, deployments, monitoring, residency setup | 7% |
The domain analyst is the role most teams skip and most regret skipping. Without someone who genuinely understands disclosure standards, engineers end up interpreting regulation from PDFs, and rework follows.
2. How Regional Rates Change the Total
| Region | Blended Hourly Rate | Effect on a $250,000 Scope |
|---|---|---|
| North America | $110 to $200 | Highest total, strongest local compliance familiarity |
| Western Europe | $90 to $160 | High total, strong CSRD and ESRS exposure |
| Eastern Europe | $45 to $85 | Balanced total with solid senior engineering depth |
| Latin America | $40 to $90 | Moderate total with strong time zone overlap for US teams |
| India and South Asia | $25 to $60 | Lowest total with the broadest availability of full-stack teams |
A blended model usually wins. Keeping architecture and domain interpretation close to your regulator while running engineering offshore protects both quality and the ESG reporting software cost.
3. Engagement Models and How They Behave on Cost
Fixed price suits a tightly defined MVP where the framework list will not move. Time and materials fit discovery-heavy work instead.
A dedicated team makes sense once you accept that the platform will keep evolving with regulation. This guide on how to hire SaaS developers breaks the trade-offs down further.
Now that you have seen who builds the platform, let us look at the routes you can take to get there.
Not sure which build path fits your compliance deadline? Speak with a Solution Specialist and get a scoped estimate against your actual reporting obligations.
5 Build Paths and What Each One Costs
Building from scratch is only one of five viable routes. Choosing the right path is often worth more than negotiating the hourly rate.
| Build Path | Typical Cost | Speed | Control | Best Fit |
|---|---|---|---|---|
| Full Custom Build | $250,000 to $750,000 | Slowest | Complete | Unique data models, product companies |
| Composable Build on APIs | $120,000 to $300,000 | Moderate | High | Teams wanting speed without lock-in |
| White-Label Core Plus Custom Layer | $80,000 to $200,000 | Fast | Medium | Fixed frameworks, tight deadlines |
| ERP or BI Stack Extension | $60,000 to $180,000 | Fast | Medium | Strong existing data infrastructure |
| Phased Hybrid | $50,000 first phase | Fastest start | Grows over time | Immediate deadline, long-term ambition |
1. Full Custom Build From Scratch
You own every decision and every line of code, which matters when your metrics or entity structure genuinely have no equivalent elsewhere. It costs the most and takes the longest, so it only makes sense when the alternative paths visibly break against your requirements.
2. Composable Build on Existing APIs and Data Services
This path assembles proven components for carbon calculation, factor libraries, and document storage, then wraps them in your own logic and interface. You move considerably faster while keeping the parts that make your platform distinctive fully under your control.
3. White-Label Core Plus a Custom Layer
A licensed core handles standard reporting while your team builds the layer your business actually needs. Licence fees continue indefinitely, so run the arithmetic across five years before treating the lower entry price as a saving.
4. Extension of Your Existing ERP or BI Stack
If your finance data already lives in a well-run warehouse, extending it is often the shortest route to a defensible report. The limitation appears later, when supplier workflows and evidence management push beyond what a BI layer was designed to carry.
5. Phased Hybrid: Buy Now, Build Later
Buy a platform to satisfy the immediate deadline while your team builds the permanent system underneath. This costs more in total, and it buys something budgets rarely can, which is time to build properly instead of building under pressure.
Build vs Buy: The Five-Year Cost Comparison
Every reference on this topic argues build versus buy without showing numbers. Here is the same decision expressed in money, using a mid-market scope on both sides.
| Year | Custom Build | Licensed Platform | Notes |
|---|---|---|---|
| Year 1 | $180,000 | $45,000 | Build carries full development; licence carries setup and subscription |
| Year 2 | $32,000 | $48,000 | Build shifts to maintenance, licence absorbs uplift |
| Year 3 | $34,000 | $52,000 | Regulatory update budget applies to both |
| Year 4 | $36,000 | $58,000 | Licence tiers usually rise with data volume |
| Year 5 | $38,000 | $64,000 | Build now amortised, licence still recurring |
| Five-Year Total | $320,000 | $267,000 | Crossover typically lands between year six and year eight |
When Buying Is the Cheaper Decision
Buying an ESG reporting platform is usually the better option if:
- You only need standard ESG reporting features.
- Your data is already organized across a few systems.
- You want a faster implementation with lower upfront costs.
- You prefer the vendor to handle regulatory updates and maintenance.
When Building Is the Cheaper Decision
Building a custom ESG reporting platform makes more sense if
- Your business has complex reporting requirements.
- You need custom metrics or multi-entity reporting.
- Annual software licensing costs are becoming too expensive.
- You plan to sell ESG reporting software as a commercial product.
Break-Even Signs to Watch For
It may be time to build your own platform when:
- Software subscription costs keep increasing every year.
- Your team relies on spreadsheets and manual workarounds.
- Your current vendor cannot support the features or customizations you need.
Also Read: SaaS vs Custom Software: Choosing What Actually Works
Tech Stack Decisions That Move ESG Reporting Software Cost
Stack choices look technical and behave financially. The table below shows where each decision lands on your budget.
| Layer | Common Choices | Cost Impact |
|---|---|---|
| Backend | Node.js, Python, Java, .NET | Python speeds calculation and AI work; Java suits heavy enterprise integration |
| Data Pipeline | Airflow, dbt, Kafka, managed ETL | Managed services cost more monthly, far less in engineering hours |
| Storage | PostgreSQL, Snowflake, BigQuery | Warehouse licensing rises with query volume and retention depth |
| Frontend | $40 to $90React, Next.js, Angular | Broadly comparable; availability of talent matters more than framework |
| Cloud | AWS, Azure, Google Cloud | Multi-region residency roughly doubles infrastructure setup effort |
1. Backend and Calculation Engine
Python earns its place when emission calculations, factor handling, and machine learning sit close together. Java and .NET make more sense when the platform must live inside an established enterprise environment with existing security and integration standards.
2. Data Pipeline, Warehouse and Storage
This is the layer that quietly determines whether reporting is fast or painful. Managed pipeline tools cost more per month and save significant build hours. This comparison of ETL and ELT approaches explains which pattern suits ESG workloads best.
3. Frontend, Dashboards and Export Formats
Framework choice matters less than export capability. Machine-readable disclosure formats are becoming standard expectations from regulators and banks, so treat structured export as a core requirement rather than a later enhancement.
4. Cloud, Hosting and Data Residency
Single-region hosting keeps infrastructure work contained and predictable. Once residency obligations apply in multiple jurisdictions, you are running parallel environments with separate compliance validation, and the setup effort rises accordingly.
8 Hidden Costs That Break ESG Reporting Software Budgets
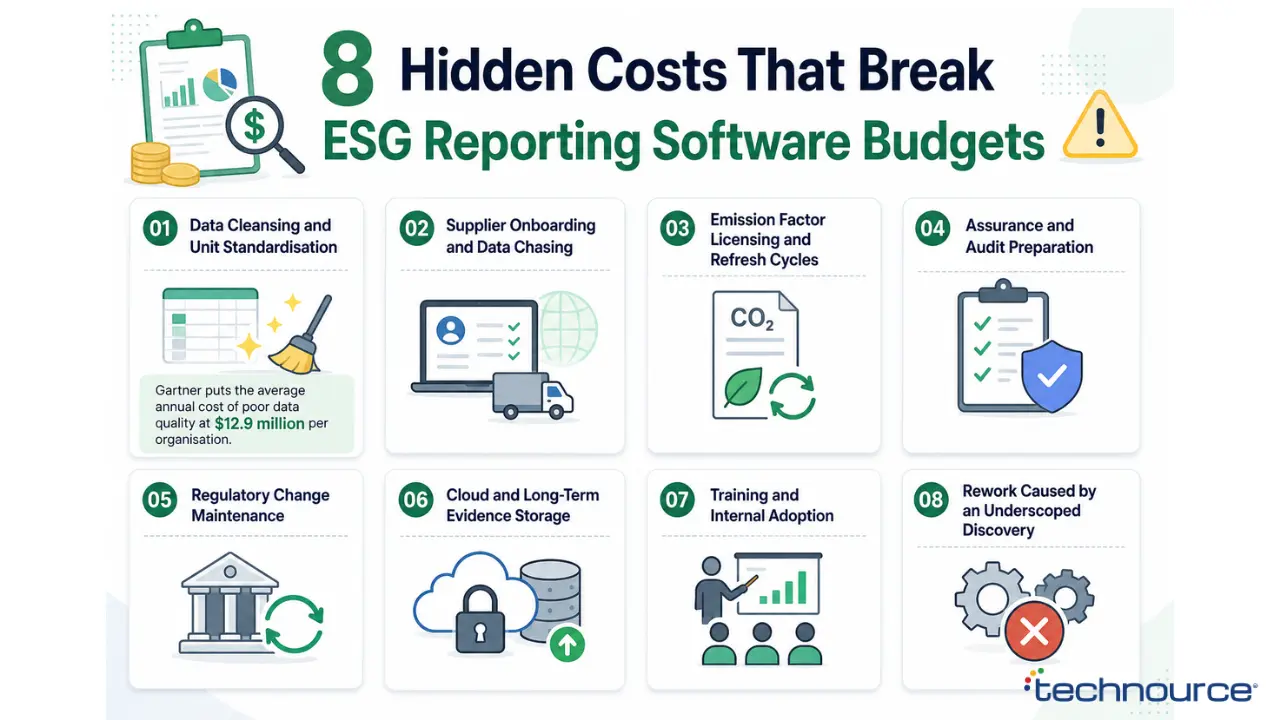
Development quotes price the software. These eight items price everything around it, and together they frequently exceed the original build number.
1. Data Cleansing and Unit Standardisation
Legacy data arrives in inconsistent units, mismatched formats, and disconnected systems. Someone has to normalise all of it before a calculation engine can touch it. Gartner puts the average annual cost of poor data quality at $12.9 million per organisation.
2. Supplier Onboarding and Data Chasing
Building the supplier portal is the easy half. Persuading hundreds of suppliers to submit usable data on schedule is an ongoing operational cost. It continues every reporting cycle, long after the build team has gone.
3. Emission Factor Licensing and Refresh Cycles
Factor libraries carry annual fees and periodic methodology updates. Each refresh needs validation work to confirm that historical figures remain intact and that new calculations use the correct version
4. Assurance and Audit Preparation
The first external assurance cycle takes considerably longer than anyone plans for. Documentation, methodology notes, and calculation evidence all need assembling, and budgeting only for software leaves this work unfunded
5. Regulatory Change Maintenance
Disclosure standards keep moving. Your platform needs a standing maintenance budget for framework amendments, new metric requirements, and threshold changes; otherwise compliance quietly degrades between reporting cycles.
6. Cloud and Long-Term Evidence Storage
Audit trails require source documents retained for years. Storage and processing costs scale with that retention, and they behave as recurring operating expenses rather than a one-off infrastructure line.
7. Training and Internal Adoption
A platform only performs as well as the discipline of the people entering data. Training across finance, procurement, and operations is usually the highest non-technical cost, and it is the one most often cut first.
8. Rework Caused by an Underscoped Discovery
Shortening discovery to reach a lower headline price is the most expensive saving available. Missed data sources and misread requirements surface during integration, where fixing them costs several times what proper mapping would have cost
What ESG Reporting Software Costs to Run After Launch
Launch is a milestone, not an endpoint. Plan on annual running costs of roughly 15% to 20% of your original build value.
| Running Cost Line | Typical Annual Range | What It Covers |
|---|---|---|
| Maintenance and Support | 10% to 15% of build cost | Bug fixes, dependency updates, performance work |
| Cloud and Infrastructure | $12,000 to $60,000 | Compute, storage, evidence retention, backups |
| Framework and Regulatory Updates | $15,000 to $45,000 | Standard amendments, new metrics, mapping changes |
| Emission Factor Licensing | $5,000 to $25,000 | Factor library subscriptions and refresh validation |
| Feature Expansion Reserve | 10% of build cost | New modules, additional entities, roadmap items |
New modules, additional entities, roadmap items
This covers the unglamorous work that keeps a platform trustworthy. Dependency upgrades, security patches, and performance tuning are all cheaper as routine maintenance than as emergency responses during a reporting deadline.
2. Cloud and Infrastructure Consumption
Infrastructure spend grows with data volume and retention obligations rather than user count. Evidence storage in particular accumulates steadily, so model it across several years instead of assuming a flat monthly figure.
3. Framework and Regulatory Update Budget
Standards evolve, and platforms that ignore that reality drift out of compliance. A ring-fenced annual budget lets your team absorb changes calmly rather than scrambling weeks before a filing.
4. Feature Expansion and Roadmap Reserve
Every successful platform generates new requests within the first two cycles. Reserving capacity for expansion prevents each new request from turning into a separate procurement exercise.
Now that the full cost picture is visible, let us turn to the question your board will actually ask about returns.
The ROI Case: How ESG Reporting Software Cost Pays Back
Cost only means something next to what it replaces. This section models the return in the same currency as the investment.
1. The Real Cost of Staying on Spreadsheets
Manual reporting hides its price across departments, which is exactly why it survives so long. A sustainability lead spending half their time on reporting, four departments contributing twenty hours per cycle, and a 20% rework rate add up fast. That reaches a six-figure annual drag before anyone counts audit friction.
2. Where the Savings Actually Come From
Savings arrive from structure rather than any single feature. Centralised collection removes consolidation work, built-in validation removes the correction loop, and traceable evidence removes the scramble that precedes every assurance review.
3. A Worked Payback Model
| Line Item | Annual Value |
|---|---|
| Sustainability lead time recovered | $40,000 |
| Departmental contributor hours saved | $28,000 |
| Rework and correction effort removed | $18,000 |
| External assurance hours reduced | $15,000 |
| Consultancy fees avoided | $25,000 |
| Total annual benefit | $126,000 |
| Annual running cost of the platform | $34,000 |
| Net annual benefit | $92,000 |
Deloitte’s Sustainability Action Report found that 57% of respondents rank data quality as their top ESG challenge, which is precisely the cost this model removes.
4. The Risk Costs You Avoid
Some returns only show up as absences. Accurate, traceable disclosure lowers exposure to greenwashing enforcement and reduces the chance of restating a published figure. It also protects financing conversations where sustainability data now carries weight.
Our work on the SkylineStay revenue intelligence dashboard followed the same pattern. Replacing manual spreadsheets with an automated pipeline delivered 90% less manual reporting and 50% fewer errors.
How Framework Coverage Changes ESG Reporting Software Cost
Framework count is the most reliable predictor of a build budget. Each standard brings its own boundaries, metrics, and evidence expectations.
| Framework | What It Demands | Build Impact | Cost Weight |
|---|---|---|---|
| CSRD and ESRS | Double materiality, Scope 1 to 3, assurance-ready evidence, structured export | Heaviest mapping and evidence workload | Very High |
| ISSB (IFRS S1 and S2) | Financially material risks, climate scenarios, financial reporting alignment | Scenario modelling and finance integration | High |
| GRI | Impact-based disclosure across environment, labour, and governance | Broad metric coverage, lighter calculation depth | Medium |
| SASB and TCFD | Industry-specific metrics and climate risk governance | Sector logic plus qualitative capture | Medium |
| CDP and EU Taxonomy | Scored questionnaires, revenue and expenditure alignment testing | Questionnaire engine and financial tagging | Medium to High |
| California SB 253 and SB 261 | Emissions disclosure and climate risk reporting for covered entities | Adds a US reporting path to existing logic | Medium |
1. CSRD and ESRS
This is the most demanding standard your platform is likely to face. Double materiality assessment, full value chain emissions, and third-party assurance all need supporting infrastructure, so it reliably carries the largest share of framework-driven cost.
2. ISSB Standards, IFRS S1 and S2
These standards pull sustainability data toward financial reporting discipline. Your platform needs climate scenario modelling and tight alignment with finance systems, which raises integration effort more than metric count.
3. GRI, SASB and TCFD
These frameworks broaden coverage rather than deepen calculation. GRI expands the metric set across social and governance topics, while SASB and TCFD add sector-specific and risk-governance disclosures that lean on qualitative capture.
4. CDP and the EU Taxonomy
CDP works through scored questionnaires, so your platform needs a response engine mapped to your existing dataset. Taxonomy alignment ties sustainability performance to revenue and expenditure, which means tagging financial line items directly.
5. California SB 253 and SB 261
These rules bring mandatory climate disclosure into scope for many US operations. For platforms already built around emissions data, this is an additional reporting path rather than a fresh architecture.
6. Why Multi-Framework Mapping Is the Real Cost Driver
Here is the point most budgets miss entirely. Frameworks define materiality and boundaries differently, so one metric may need several valid versions. Building a single dataset that serves them all is the hardest engineering problem in the platform.
Also Read: ETL vs ELT Explained: Architecture, Use Cases and Best Practices
10 Ways to Reduce ESG Reporting Software Cost Without Losing Compliance
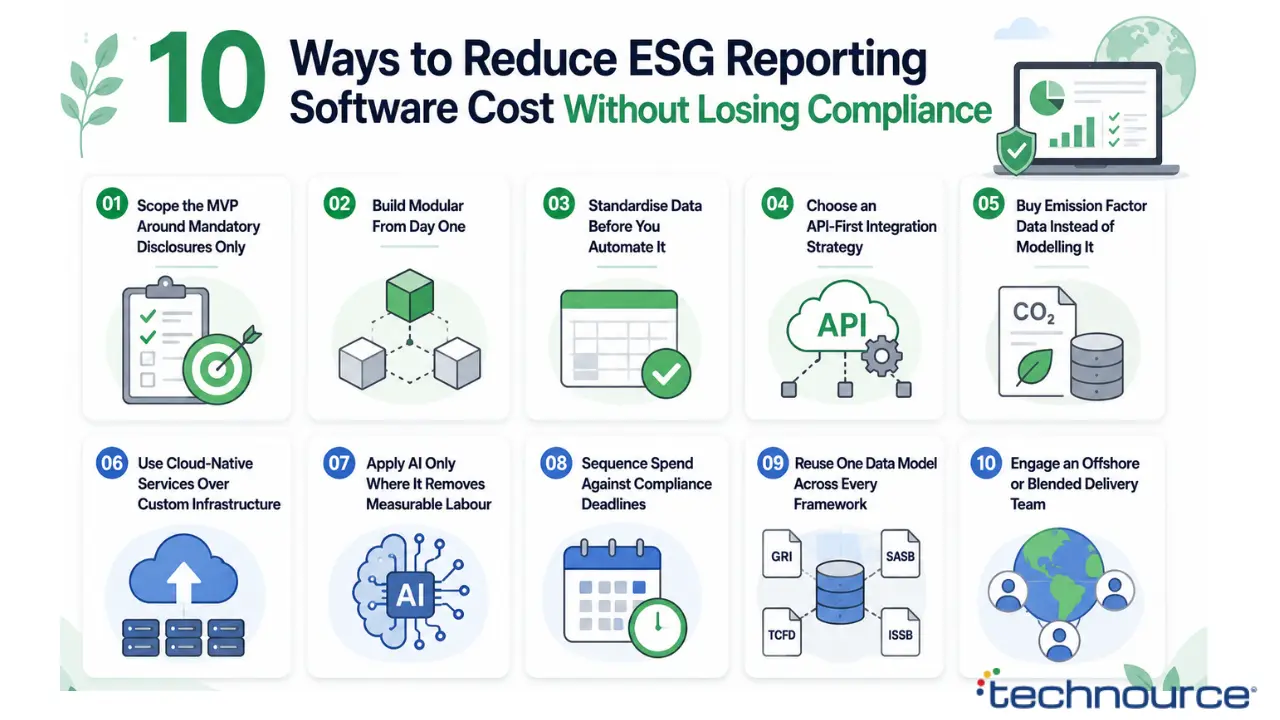
Cutting costs is not about finding cheaper engineers. It is about making sharper scope decisions before development starts.
1. Scope the MVP Around Mandatory Disclosures Only
Fund what a regulator will actually ask for and defer everything else. Voluntary metrics and nice-to-have dashboards can wait for phase two, once real usage tells you which ones people open.
2. Build Modular From Day One
Modular architecture lets you add frameworks and entities later without touching core logic. It costs slightly more upfront and consistently saves far more than that during the second and third reporting cycles.
3. Standardise Data Before You Automate It
Automating a messy process just produces mess faster. Cleaning units, naming conventions, and ownership first reduces build complexity and shortens integration, which lowers the ESG reporting software cost directly.
4. Choose an API-First Integration Strategy
Standard connection patterns beat bespoke code for every system. API-first design means adding a new data source becomes configuration work rather than a fresh engineering project each time.
5. Buy Emission Factor Data Instead of Modelling It
Licensed factor libraries are far cheaper than building and maintaining your own. They also carry methodological credibility that an auditor recognises, which shortens assurance conversations.
6. Use Cloud-Native Services Over Custom Infrastructure
Managed databases, queues, and storage remove weeks of infrastructure engineering. You trade a predictable monthly fee for build hours, and on ESG workloads, that trade almost always favours the managed option.
7. Apply AI Only Where It Removes Measurable Labour
AI features carry a real premium, so tie each one to hours saved. Anomaly detection on supplier data usually justifies itself quickly, while generative narrative drafting deserves a stricter business case.
8. Sequence Spend Against Compliance Deadlines
Fund capability in the order your obligations arrive. Building everything simultaneously ties up capital in features that will not be needed for another two reporting cycles.
9. Reuse One Data Model Across Every Framework
Collect a metric once and map it outward to each standard. Framework-specific data collection duplicates effort at every level, from entry screens through to storage and validation.
10. Engage an Offshore or Blended Delivery Team
Regional rate differences are significant enough to reshape a budget entirely. This guide on outsourcing software development covers how to structure that relationship without losing delivery control.
How to Pressure-Test an ESG Reporting Software Cost Quote
A low quote is not automatically a good one. These checks separate genuine efficiency from scope that will reappear later as change requests.
7 Red Flags in a Suspiciously Low Quote
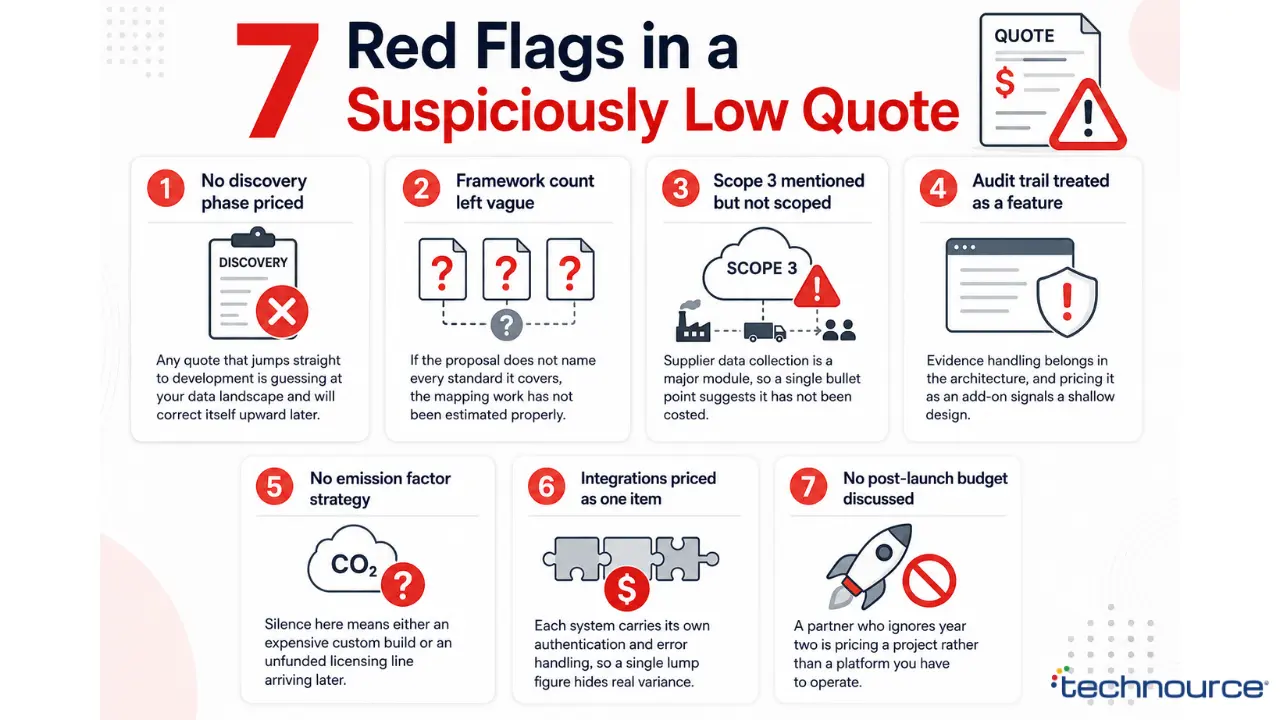
- No discovery phase priced: Any quote that jumps straight to development is guessing at your data landscape and will correct itself upward later.
- Framework count left vague: If the proposal does not name every standard it covers, the mapping work has not been estimated properly.
- Scope 3 mentioned but not scoped: Supplier data collection is a major module, so a single bullet point suggests it has not been costed.
- Audit trail treated as a feature: Evidence handling belongs in the architecture, and pricing it as an add-on signals a shallow design.
- No emission factor strategy: Silence here means either an expensive custom build or an unfunded licensing line arriving later.
- Integrations priced as one item: Each system carries its own authentication and error handling, so a single lump figure hides real variance.
- No post-launch budget discussed: A partner who ignores year two is pricing a project rather than a platform you have to operate.
8 Questions to Answer Before You Approve the Budget’
- Which reporting frameworks must the platform support at launch?
- Where does the required ESG data currently live?
- How much of Scope 3 reporting is in scope?
- What level of assurance will the platform need to support?
- How many legal entities need to be consolidated?
- Who owns ESG data entry across each department?
- What is your annual budget for running the platform?
- Do you plan to sell this software commercially in the future?
Why Technource for ESG Reporting Software Development
Compliance platforms punish shortcuts, so partner selection carries real weight here.
Technource brings 13+ years of engineering experience, 1,000+ delivered projects, 70+ in-house tech experts, and 300+ clients served across global markets.
What we bring to an ESG reporting build:
- End-to-end ownership: Discovery, product engineering, QA, deployment, and long-term support sit with one accountable team.
- Data engineering at the core: We build the pipelines, warehousing, and transformation layers that reporting accuracy depends on, not just the interface above them.
- Proven reporting automation: Our SkylineStay dashboard replaced manual spreadsheets with an automated pipeline, delivering 90% less manual reporting and 50% fewer errors.
- Secure-by-design architecture: Access control, encryption, and evidence handling are built into the data model rather than added after the fact.
- AI-powered automation where it pays: Our VoiceMate AI work cut human dependency by 70% and improved response times by 80%. We apply the same discipline to ESG workflows.
- Modular delivery: We sequence builds against your actual compliance deadlines so capital goes where the obligation is.
Still relying on manual work while competitors grow with AI? Schedule a Free Call, and we will map your reporting obligations to a cost build plan.
Conclusion
ESG reporting software cost is never one number, and treating it as one is how budgets go wrong. It is a set of decisions about frameworks, data depth, integration reach, and how much assurance work you automate rather than absorb.
The organisations that spend well are rarely the ones that spend least. They scope tightly against real obligations, build modular systems, and fund the data work that everything else depends on.
We hope this guide helped you understand what sits behind every line of an ESG reporting software cost estimate. You can also see where budgets leak and how the return accumulates.
You now have the build tiers, the phase splits, the module pricing, and a payback model you can take to a board.
Now it is your turn. Map your reporting obligations, list your data sources, decide your build path, and pressure-test the first quote that reaches your desk.
If you want an estimate grounded in engineering reality, connect with our experts to scope your ESG reporting platform and build it with confidence.
FAQs
Custom builds generally range from $60,000 for a compliance-ready MVP to $750,000 or more for an AI-powered enterprise platform. Framework count, Scope 3 depth, and integration volume explain most of that variation. A focused MVP typically takes four to six months, while a full enterprise platform runs nine to eighteen months. Integration count and assurance requirements influence the timeline more than feature count does. Over five years, licensing usually costs less for standard reporting needs. Building becomes cheaper once entity complexity, unusual metrics, or per-user licence growth push subscriptions past a six-figure annual run rate. Framework coverage and Scope 3 supplier data collection are the two heaviest drivers. Together they can account for close to half of an enterprise build budget before any other module is priced. 5. What are the hidden costs in an ESG software build?
Data cleansing, supplier onboarding, emission factor licensing, assurance preparation, and regulatory maintenance are the common ones. These sit outside most development quotes yet frequently exceed the build figure itself.
The post ESG Reporting Software Cost in 2026: Pricing, Features & ROI appeared first on Technource.


![Mumford & Sons – Blind Leading the Blind – Single [iTunes Plus M4A]](http://is1-ssl.mzstatic.com/image/thumb/Music124/v4/49/c3/83/49c38304-45c6-20d0-c6df-3b36ea8bd92a/19UMGIM89194.rgb.jpg/316x316bb.webp)